A Data Visualisation Feature
A new dot appears on the screen every hour. It is a Global Positioning System (GPS) fix, a real-time update on a large carnivore that has been rescued from a potentially dangerous situation in a human dominated space in Madhya Pradesh. Attached with a GPS collar, it has been translocated to a more suitable habitat. The GPS collars on the rescued and translocated leopards and tigers communicate with the eyes in the sky, aka the satellites, and help Wildlife Conservation Trust (WCT) scientists keep a tab on animals’ movements. These observations are communicated to the Madhya Pradesh Forest Department on a daily, or sometimes even hourly basis.
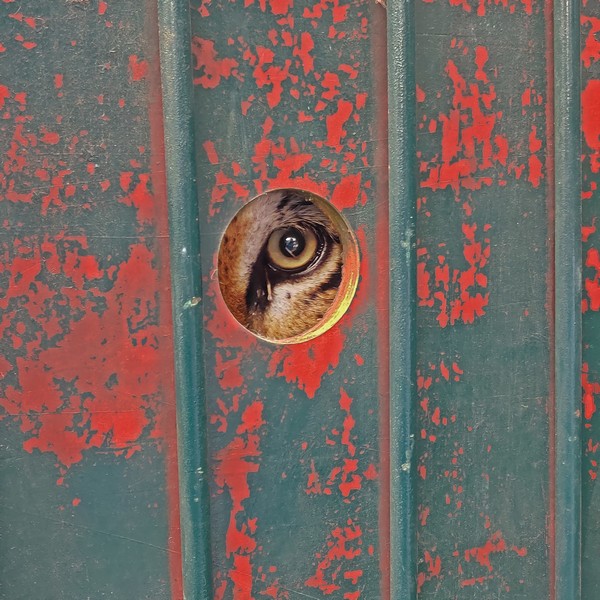
Rescue and translocation of large carnivores, coupled with satellite telemetry, is a challenging yet preferred approach to managing negative human-carnivore interactions. Photo: WCT
There is hardly a conservation problem more complex, challenging, sensitive, and dangerous as negative human-wildlife interactions. And when large carnivores such as tigers and leopards are at the centre of such situations, the situation can rapidly escalate and become challenging. The Forest Department staff and field teams have to respond, strategise, and take management decisions with alacrity to ensure both people and animals are safe. The satellite telemetry method is helping the Madhya Pradesh Forest Department achieve this, with assistance from organisations such as WCT.
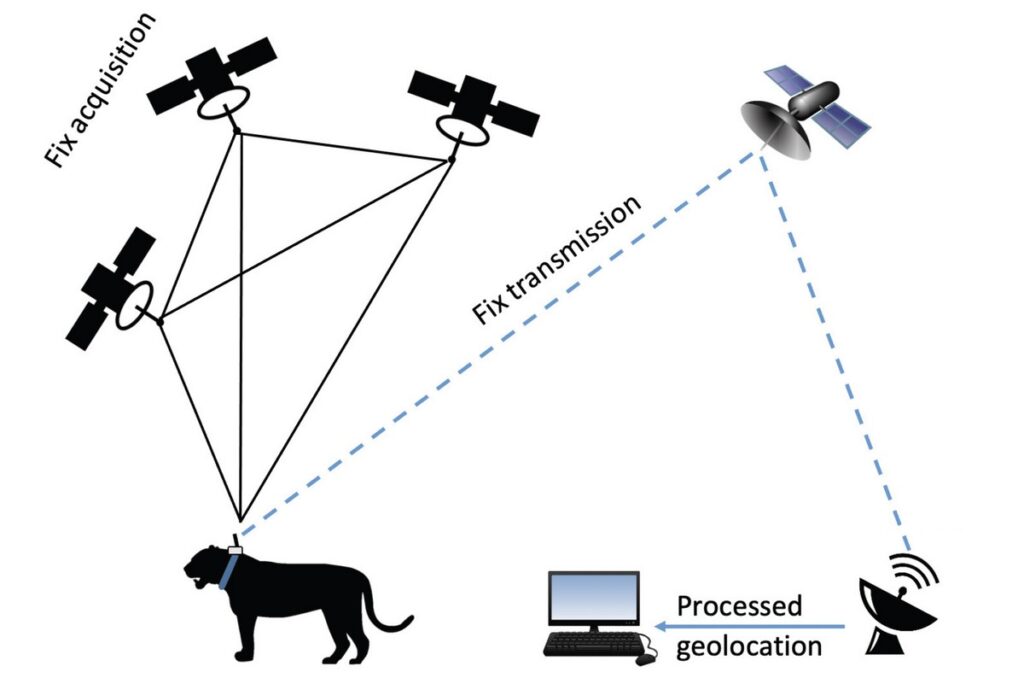
A schematic diagram explaining the process of satellite telemetry, and GPS fix and transmission to the end user. Photo: WCT
In scenarios where people and carnivores interface with each other, wildlife managers prefer the method of rescue and translocation, since it is non-lethal. Coupled with satellite telemetry, this method is equipping State Forest Departments with tools to manage negative human-carnivore interactions more proactively. Once a tiger or a leopard – that is repeatedly getting into conflict with local communities – is identified, it is captured and relocated to a Protected Area, thus ensuring safety for people as well as carnivores. But the work doesn’t end there.
A translocated animal is first fitted with a GPS collar before being released into a predetermined forest area, where it is continuously monitored until it adapts to its new environs, which may take anywhere from a few weeks to many months. Monitoring them using satellite and radio telemetry ensures timely intervention if the animal exhibits habits that are potentially dangerous for humans. Once the Forest Department and scientists are assured that the animal has established its territory, is hunting wild prey successfully, and avoids interactions with humans, the collar is remotely dropped off!
In the next few pages, you will see some intriguing maps, graphs, and figures. While interesting to look at, they may seem inscrutable. What are they telling us? Interpreting them is a task for trained eyes. The visualisations you see here hold precious and fascinating information obtained using satellite telemetry to monitor and track rehabilitated tigers and leopards in real time. This information is analysed to further understand their behaviour, ecology, and adaptive prowess in human-altered landscapes. Observing and analysing such data also tells us of the challenges faced by the translocated carnivores and the lessons that can be applied to future translocations to minimise stress caused to the animals, and limit their interactions with humans living in and around their new territories.
This entire feature is an exercise in visualising large carnivores through the mind’s eye.
Note: Many details such as names of the capture and release locations, time, identity of the animals, etc. have not been divulged in the feature owing to their sensitive nature.
Visualising Leopards Post Rescue And Translocation
When studying animals and their behaviour, scientists utilise two main concepts to describe how animals use their living space. The first is the ‘home range’, which refers to the area where an animal performs essential activities such as eating, sleeping, and reproducing. The second concept is the core area, the most frequently used part of the home range, where the animal spends the majority of its time owing to higher resource availability.
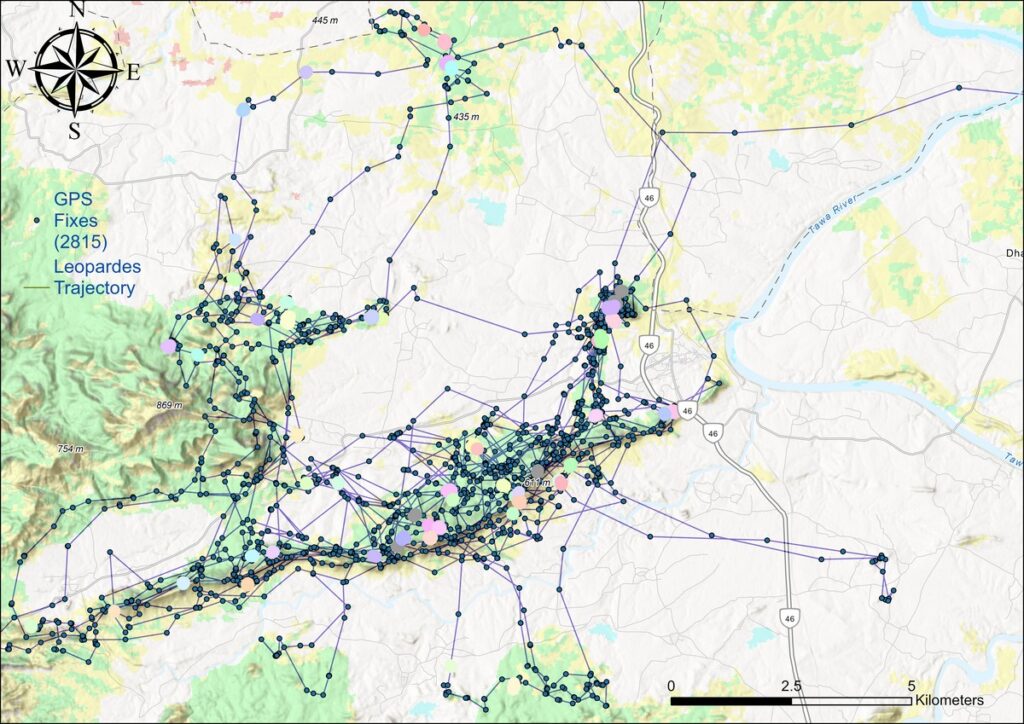
Above: Like a game of connecting the dots, connecting the GPS locations of the rescued and translocated leopardess gives us a sense of the cat’s spatial behaviour, with a focus on how she navigates her habitat, her proximity to human settlements, and the landscape features she uses. An analysis of the clusters of the GPS locations further informs us of her key behaviours. The large cluster in this map tells us that the leopardess used that area to rest and hunt, all the while strategically avoiding human infrastructure such as highways and railway tracks.
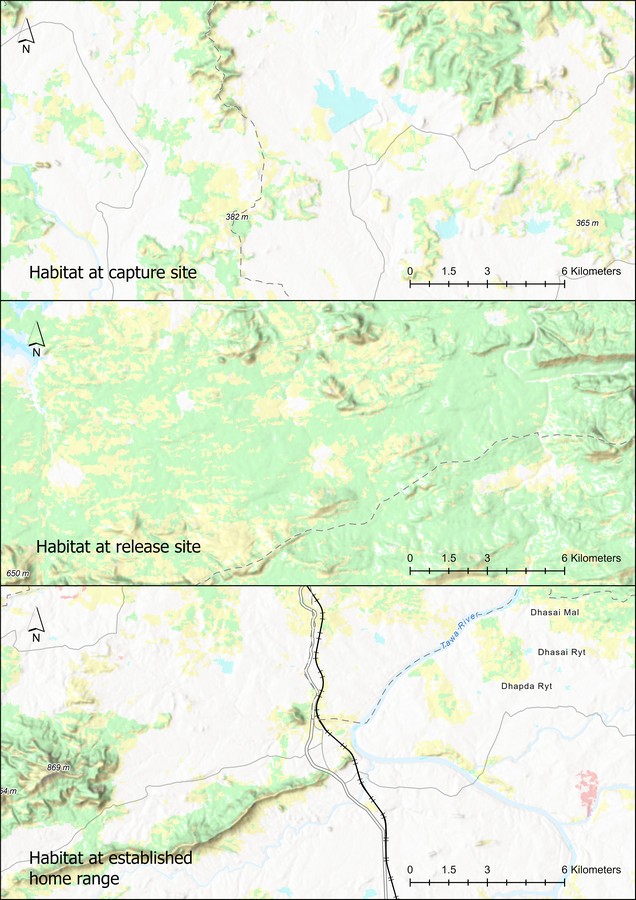
Above: This visualisation compares the habitats of a translocated leopardess’s capture and release sites, with the site at which it finally established its home range post translocation. The significant difference in the habitats at the capture and release sites influenced the leopardess’s behaviour and movement patterns post-release. Overall, the leopardess’s capture site and the established home range have notable similarities in forest cover, predator density, prey type, and human influence, while the release site differed significantly in these aspects. This suggests that releasing relocated animals in habitats similar to their capture site may promote quicker acclimatisation, reduce stress that is caused to it while exploring new territory, while also supporting stabler territory establishment. Photo: WCT
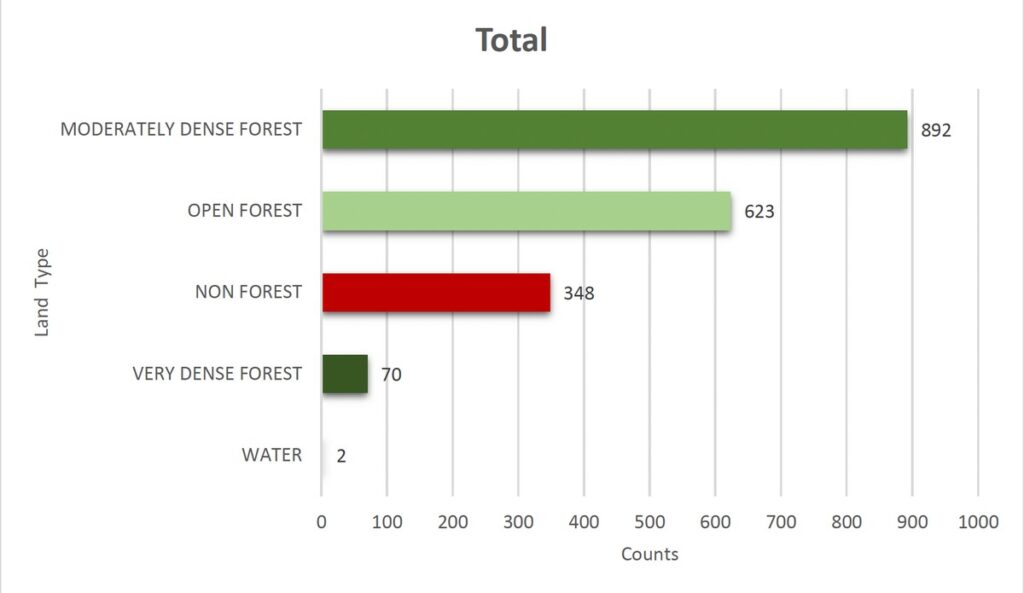
Above: This graph is indicative of the time spent by a translocated leopardess in different types of habitats in and around the release site. In this case, the leopardess predominantly utilised Moderately Dense Forest and Open Forest. However, the notable use of Non-Forest areas suggests that the leopardess may have engaged in activities such as hunting or traveling outside forest boundaries. This flexibility in habitat usage shows that non-forested areas are also important for the leopardess, possibly providing access to prey or other resources.
After the leopardess was captured from a house near the forest boundary, it was deemed necessary to relocate her to avoid further conflict with local human populations. However, her release led to extensive roaming behaviour. Over a period of 14 days, she travelled 113 km. In the following days, the GPS data indicated her return to a typical hunting pattern, confirming her ability to hunt effectively in her new territory. Despite her extensive movements and initial lack of a defined territory, no negative human interactions were recorded during this period. This is encouraging, as it implies that her exploratory behaviour was directed towards finding a suitable territory and prey rather than human settlements, reducing the potential for negative human-wildlife interactions. Photo: WCT
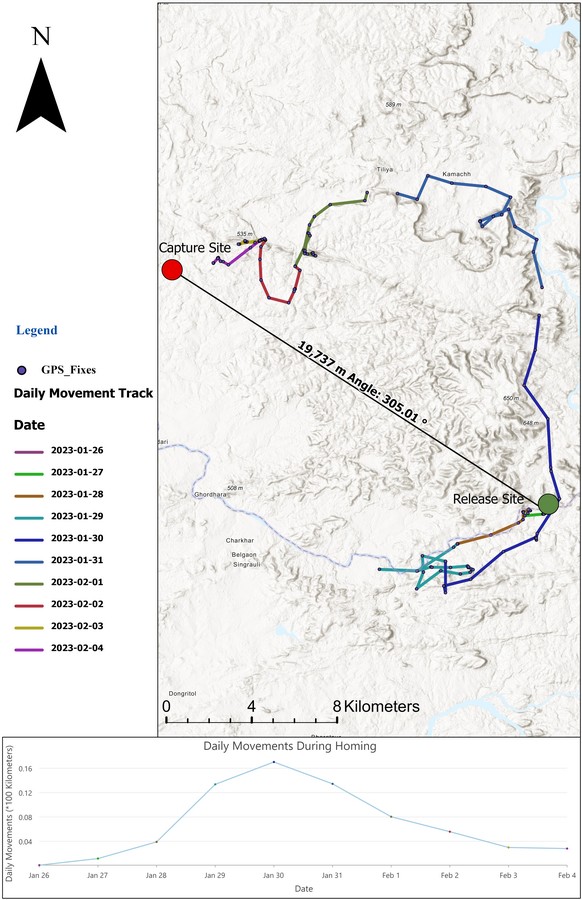
Above: Here, a leopardess was captured near a village and released some 20 km. away (as the crow flies). However, she returned to her capture site with remarkable speed and accuracy. The map shows the capture and release sites and daily movement tracks until she returned to her capture site. Photo: WCT
Some major learnings from studying the translocation of this leopardess:
- She showed site fidelity and displayed homing behaviour to return to the capture site within seven days.
- Upon returning to the capture site, the leopardess was not averse to getting close to human habitation, although there were no conflict issues.
- The majority of the leopardess’s locations are within a kilometre of human habitation.
- The leopardess is significantly more active at dawn and dusk compared to day- and night-time. This is also the time when leopards generally move closer to human habitation.
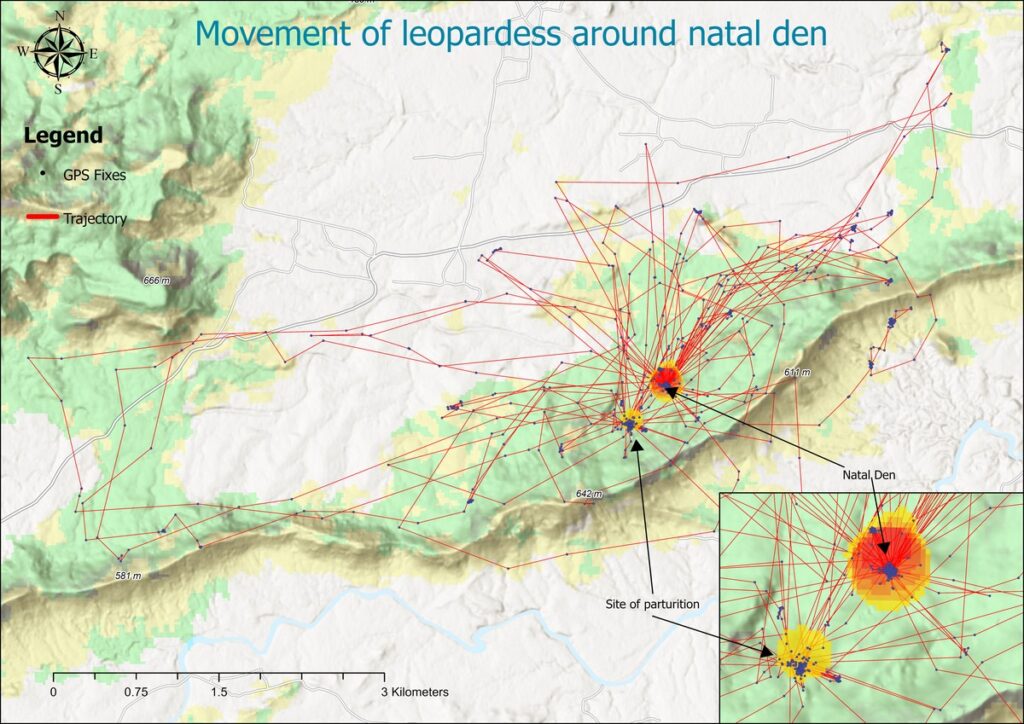
Above: Observation of the GPS fixes (black dots) and movement trajectories (red lines) in relation to topographic and vegetative features in the map illustrate the movement patterns of a leopardess around her natal den, highlighting dense activity near the den site with frequent entry and exit pathways, as well as the site of parturition (the process of giving birth). The dense web of trajectories suggests high activity within this area, likely owing to the leopardess’s need to budget time for hunting and returning to care for her cubs. Photo: WCT
Visualising Tigers Post Rescue And Translocation
The Madhya Pradesh Forest Department’s efforts in rehabilitating injured, diseased and debilitated tigers have been a crucial part of conservation. By providing medical care and rehabilitation, these tigers are given the opportunity to recover and be reintroduced into their natural habitat, helping to maintain the region’s tiger population and promote biodiversity.
Rehabilitation and release of tigers in the wild are complex processes. Their success depends on a variety of factors ranging from the temperament of the tiger to be released, to the acceptance of communities towards the presence of the tiger in their vicinity.
A key responsibility of wildlife managers is to monitor the tigers’ survival and settlement at release sites, and prevent negative interactions between them and humans. In order to ensure the survival of rehabilitated animals in the wild, they must be tracked for an extended period of time. Tracking large-ranging animals such as tigers over time is most easily accomplished with GPS collars, which are accurate, labour efficient, and inexpensive.
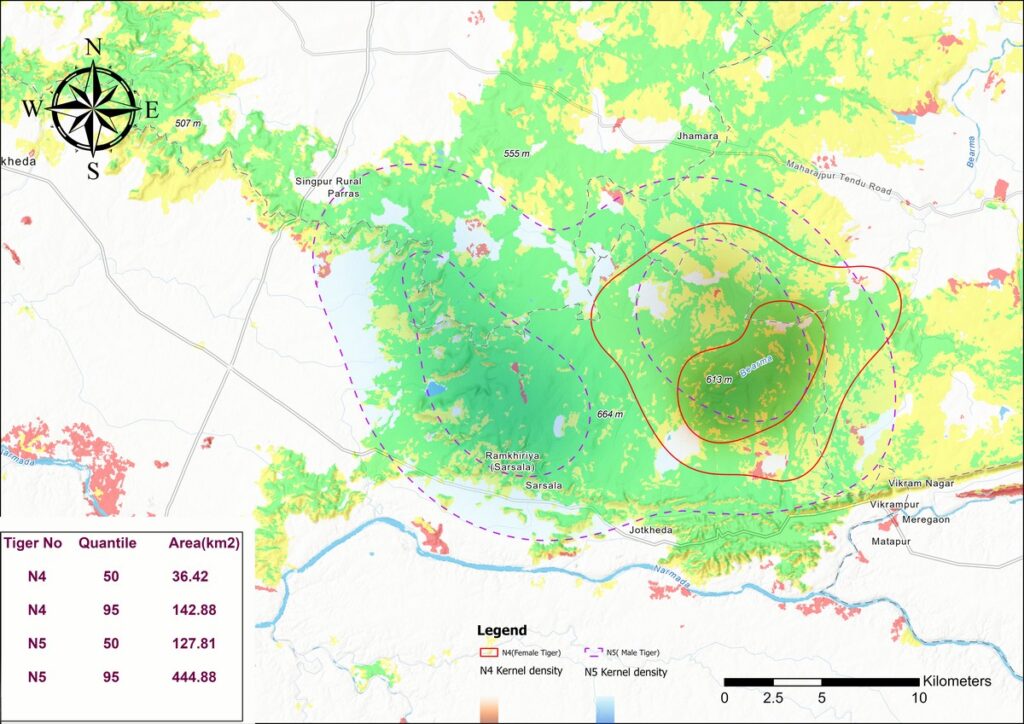
Above: This map shows the home ranges of two male tigers rescued from different conflict situations, and translocated to a Protected Area in Madhya Pradesh. This visualisation was created using the GPS locations of the two tigers. The dotted line indicates the territory of one male tiger, while the solid line represents that of another male. The inner contours of each of their territories indicate where each tiger spent the most time and core areas for hunting and resting. The space between the inner and outer contours represents regions that each tiger visited less frequently. It is interesting to note the extent of overlap between the two distinct home ranges of these male tigers, indicating shared territory.
Such information is crucial for conservation efforts, as it helps us better understand the spatial needs and preferences of these tigers, ultimately contributing to their protection and the preservation of their natural habitats. Photo: WCT
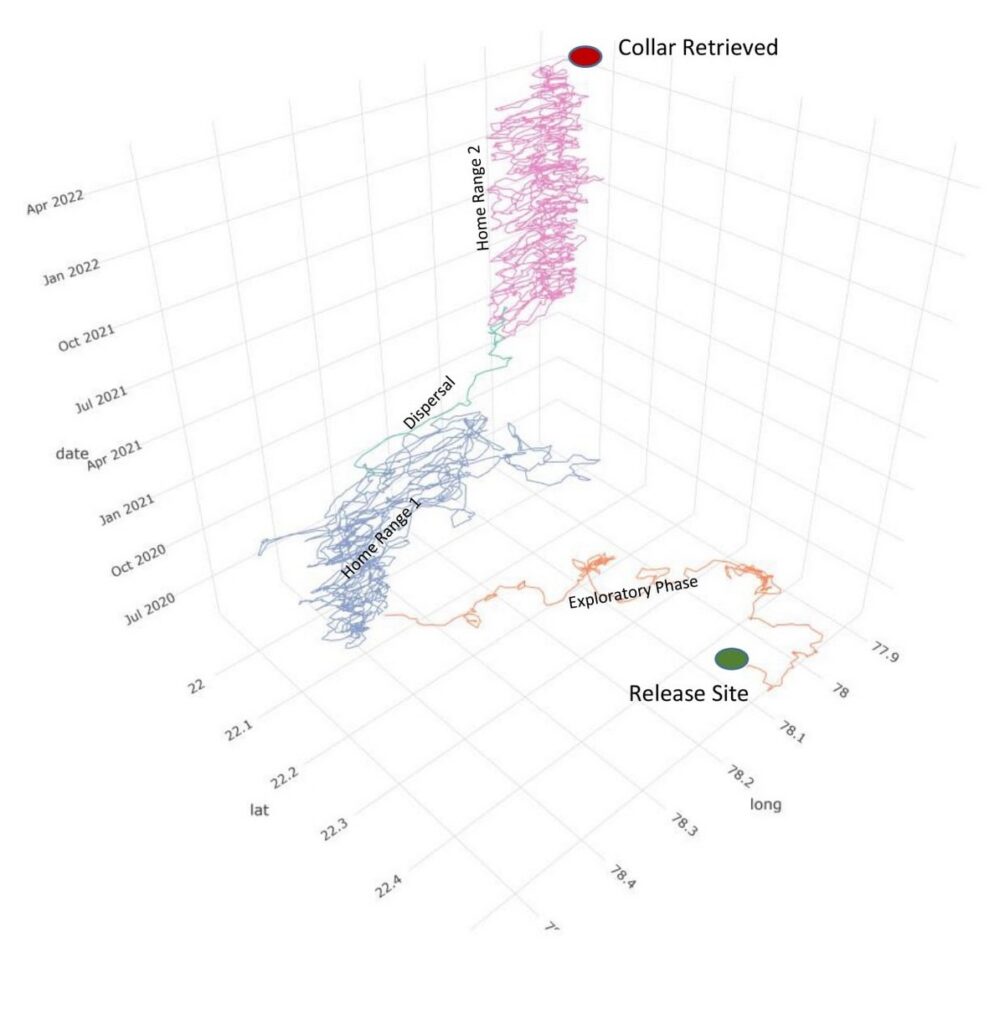
Above: This space-time cube depicts the trajectory of a tigress’s movements in three dimensions – longitude, latitude, and time – documented in the two years that she was being monitored using satellite telemetry. The green circle is her release site in a Protected Area. The red circle is located in a territorial forest (10 km.) from where the collar was retrieved after it was remotely dropped off. The line is the trajectory of the tigress traced based on the GPS fixes received over the course of satellite tracking. Photo: WCT
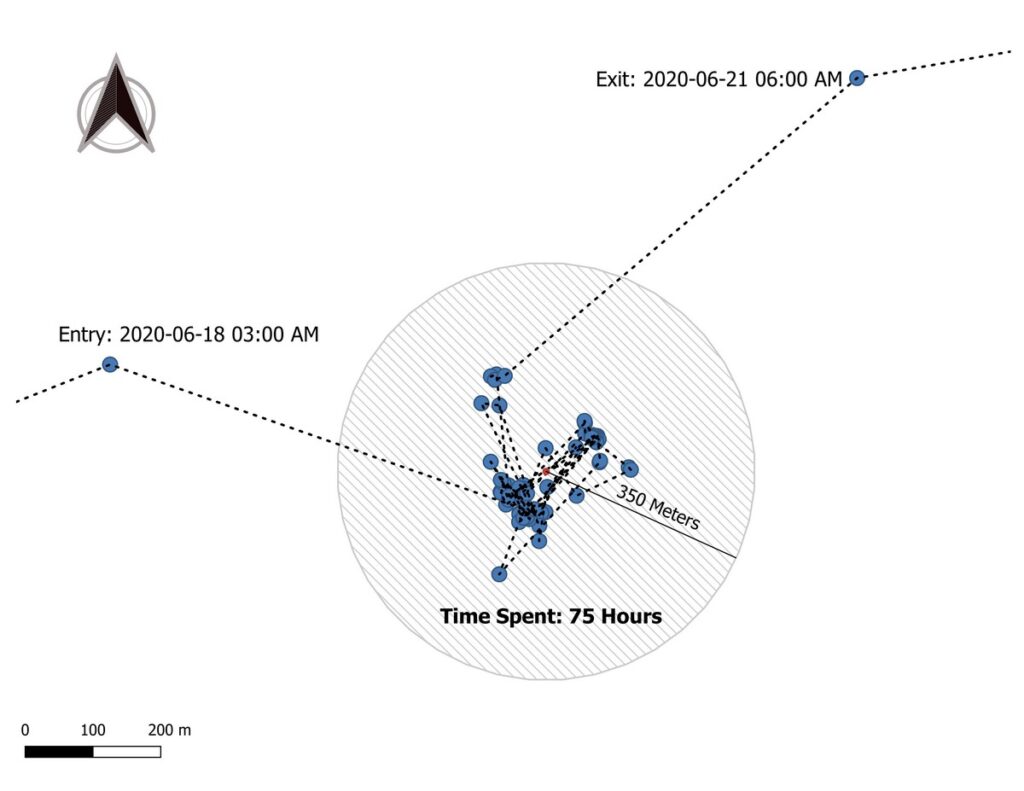
Above: ‘GPS location cluster analysis’ is a technique used to identify the timing and location of behavioural events. High-resolution GPS location data has improved the ability of the researchers to accurately pinpoint kill sites and provide insights into other animal behaviour such as resting, habitat selection, and natal denning. The interpretation of a translocated tigress’s GPS locations in this graphic indicates patterns, movement trajectory, and the time spent in an area to be characteristic of a kill site. This exercise further helped the WCT scientists predict the tigress’s kill rate, kill sites, and maternal events. Photo: WCT
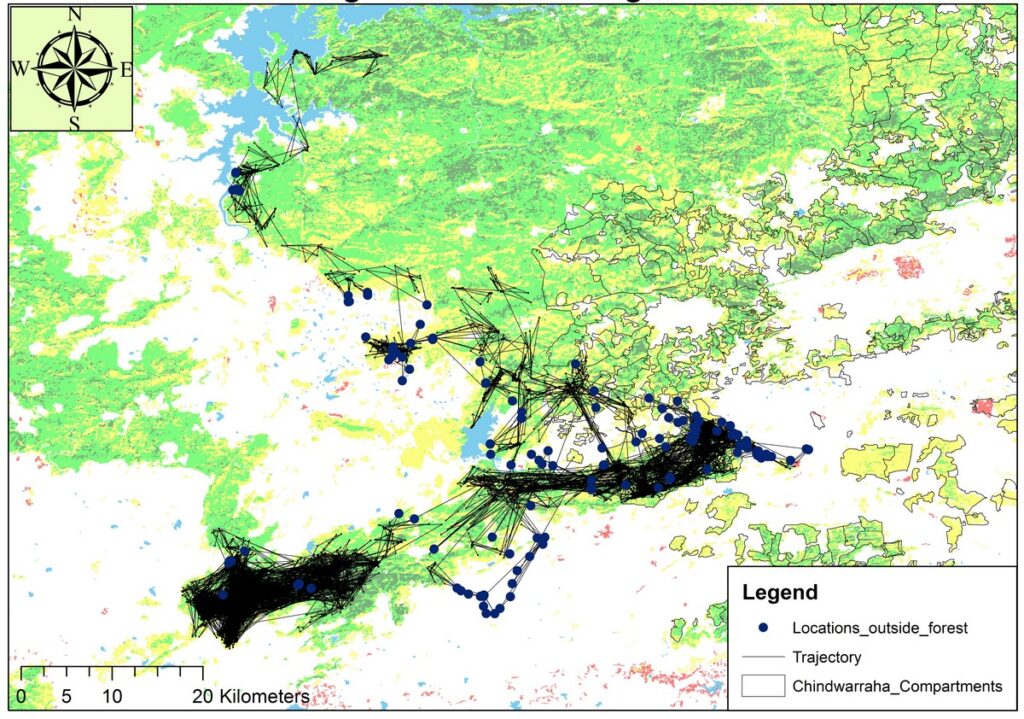
Above: This map depicts the trajectory of a translocated tigress at the forest-agriculture interface. The points represent the locations of the tigress’s movement outside the forest. It is visually evident that, most of the time, upon reaching agricultural land or venturing close to human settlement, she turned back sharply or moved faster in a linear fashion towards the forest. The tigress moved faster and straighter when she was outside the forest. A faster, straighter movement might indicate that the tigress perceives the habitat to pose greater risks. The movement strategies adopted by the tigress in human-dominated landscapes has ensured that no negative human-tiger interaction occurred in the two years since her release.
Out of the 15,000+ hours of recording the tigress’s movements, she spent only 321 hours outside the forest. This is significant as it demonstrates that the tigress maintained a strict spatial and temporal barrier between her and spaces of human activities. Photo: WCT
This article was originally published in the February 2025 issue of Sanctuary Asia.
Your donations support our on-ground operations, helping us meet our conservation goals.
Related Links
- Man’s Best Friend: Sniffer Dogs Aid in Pangolin Conservation
- Birding in Tigerland
- Why are Connectivity and Corridors touted as the lifeblood of ecosystem conservation?
- Connectivity Conservation
- River Animals and River People: For a Shared Future